- Research article
- Open access
- Published:
A review of the quantitative effectiveness evidence synthesis methods used in public health intervention guidelines
BMC Public Health volume 21, Article number: 278 (2021)
Abstract
Background
The complexity of public health interventions create challenges in evaluating their effectiveness. There have been huge advancements in quantitative evidence synthesis methods development (including meta-analysis) for dealing with heterogeneity of intervention effects, inappropriate ‘lumping’ of interventions, adjusting for different populations and outcomes and the inclusion of various study types. Growing awareness of the importance of using all available evidence has led to the publication of guidance documents for implementing methods to improve decision making by answering policy relevant questions.
Methods
The first part of this paper reviews the methods used to synthesise quantitative effectiveness evidence in public health guidelines by the National Institute for Health and Care Excellence (NICE) that had been published or updated since the previous review in 2012 until the 19th August 2019.The second part of this paper provides an update of the statistical methods and explains how they address issues related to evaluating effectiveness evidence of public health interventions.
Results
The proportion of NICE public health guidelines that used a meta-analysis as part of the synthesis of effectiveness evidence has increased since the previous review in 2012 from 23% (9 out of 39) to 31% (14 out of 45). The proportion of NICE guidelines that synthesised the evidence using only a narrative review decreased from 74% (29 out of 39) to 60% (27 out of 45).An application in the prevention of accidents in children at home illustrated how the choice of synthesis methods can enable more informed decision making by defining and estimating the effectiveness of more distinct interventions, including combinations of intervention components, and identifying subgroups in which interventions are most effective.
Conclusions
Despite methodology development and the publication of guidance documents to address issues in public health intervention evaluation since the original review, NICE public health guidelines are not making full use of meta-analysis and other tools that would provide decision makers with fuller information with which to develop policy. There is an evident need to facilitate the translation of the synthesis methods into a public health context and encourage the use of methods to improve decision making.
Background
To make well-informed decisions and provide the best guidance in health care policy, it is essential to have a clear framework for synthesising good quality evidence on the effectiveness and cost-effectiveness of health interventions. There is a broad range of methods available for evidence synthesis. Narrative reviews provide a qualitative summary of the effectiveness of the interventions. Meta-analysis is a statistical method that pools evidence from multiple independent sources [1]. Meta-analysis and more complex variations of meta-analysis have been extensively applied in the appraisals of clinical interventions and treatments, such as drugs, as the interventions and populations are clearly defined and tested in randomised, controlled conditions. In comparison, public health studies are often more complex in design, making synthesis more challenging [2].
Many challenges are faced in the synthesis of public health interventions. There is often increased methodological heterogeneity due to the inclusion of different study designs. Interventions are often poorly described in the literature which may result in variation within the intervention groups. There can be a wide range of outcomes, whose definitions are not consistent across studies. Intermediate, or surrogate, outcomes are often used in studies evaluating public health interventions [3]. In addition to these challenges, public health interventions are often also complex meaning that they are made up of multiple, interacting components [4]. Recent guidance documents have focused on the synthesis of complex interventions [2, 5, 6]. The National Institute for Health and Care Excellence (NICE) guidance manual provides recommendations across all topics that are covered by NICE and there is currently no guidance that focuses specifically on the public health context.
Research questions
A methodological review of NICE public health intervention guidelines by Achana et al. (2014) found that meta-analysis methods were not being used [3]. The first part of this paper aims to update and compare, to the original review, the meta-analysis methods being used in evidence synthesis of public health intervention appraisals.
The second part of this paper aims to illustrate what methods are available to address the challenges of public health intervention evidence synthesis. Synthesis methods that go beyond a pairwise meta-analysis are illustrated through the application to a case study in public health and are discussed to understand how evidence synthesis methods can enable more informed decision making.
The third part of this paper presents software, guidance documents and web tools for methods that aim to make appropriate evidence synthesis of public health interventions more accessible. Recommendations for future research and guidance production that can improve the uptake of these methods in a public health context are discussed.
Update of NICE public health intervention guidelines review
NICE guidelines
The National Institute for Health and Care Excellence (NICE) was established in 1999 as a health authority to provide guidance on new medical technologies to the NHS in England and Wales [7]. Using an evidence-based approach, it provides recommendations based on effectiveness and cost-effectiveness to ensure an open and transparent process of allocating NHS resources [8]. The remit for NICE guideline production was extended to public health in April 2005 and the first recommendations were published in March 2006. NICE published ‘Developing NICE guidelines: the manual’ in 2006, which has been updated since, with the most recent in 2018 [9]. It was intended to be a guidance document to aid in the production of NICE guidelines across all NICE topics. In terms of synthesising quantitative evidence, the NICE recommendations state: ‘meta-analysis may be appropriate if treatment estimates of the same outcome from more than 1 study are available’ and ‘when multiple competing options are being appraised, a network meta-analysis should be considered’. The implementation of network meta-analysis (NMA), which is described later, as a recommendation from NICE was introduced into the guidance document in 2014, with a further update in 2018.
Background to the previous review
The paper by Achana et al. (2014) explored the use of evidence synthesis methodology in NICE public health intervention guidelines published between 2006 and 2012 [3]. The authors conducted a systematic review of the methods used to synthesise quantitative effectiveness evidence within NICE public health guidelines. They found that only 23% of NICE public health guidelines used pairwise meta-analysis as part of the effectiveness review and the remainder used a narrative summary or no synthesis of evidence at all. The authors argued that despite significant advances in the methodology of evidence synthesis, the uptake of methods in public health intervention evaluation is lower than other fields, including clinical treatment evaluation. The paper concluded that more sophisticated methods in evidence synthesis should be considered to aid in decision making in the public health context [3].
Methods
The search strategy used in this paper was equivalent to that in the previous paper by Achana et al. (2014)[3]. The search was conducted through the NICE website (https://www.nice.org.uk/guidance) by searching the ‘Guidance and Advice List’ and filtering by ‘Public Health Guidelines’ [10]. The search criteria included all guidance documents that had been published from inception (March 2006) until the 19th August 2019. Since the original review, many of the guidelines had been updated with new documents or merged. Guidelines that remained unchanged since the previous review in 2012 were excluded and used for comparison.
The guidelines contained multiple documents that were assessed for relevance. A systematic review is a separate synthesis within a guideline that systematically collates all evidence on a specific research question of interest in the literature. Systematic reviews of quantitative effectiveness, cost-effectiveness evidence and decision modelling reports were all included as relevant. Qualitative reviews, field reports, expert opinions, surveillance reports, review decisions and other supporting documents were excluded at the search stage.
Within the reports, data was extracted on the types of review (narrative summary, pairwise meta-analysis, network meta-analysis (NMA), cost-effectiveness review or decision model), design of included primary studies (randomised controlled trials or non-randomised studies, intermediate or final outcomes, description of outcomes, outcome measure statistic), details of the synthesis methods used in the effectiveness evaluation (type of synthesis, fixed or random effects model, study quality assessment, publication bias assessment, presentation of results, software). Further details of the interventions were also recorded, including whether multiple interventions were lumped together for a pairwise comparison, whether interventions were complex (made up of multiple components) and details of the components. The reports were also assessed for potential use of complex intervention evidence synthesis methodology, meaning that the interventions that were evaluated in the review were made up of components that could potentially be synthesised using an NMA or a component NMA [11]. Where meta-analysis was not used to synthesis effectiveness evidence, the reasons for this was also recorded.
Results
Search results and types of reviews
There were 67 NICE public health guidelines available on the NICE website. A summary flow diagram describing the literature identification process and the list of guidelines and their reference codes are provided in Additional files 1 and 2. Since the previous review, 22 guidelines had not been updated. The results from the previous review were used for comparison to the 45 guidelines that were either newly published or updated.
The guidelines consisted of 508 documents that were assessed for relevance. Table 1 shows which types of relevant documents were available in each of the 45 guidelines. The median number of relevant articles per guideline was 3 (minimum = 0, maximum = 10). Two (4%) of the NICE public health guidelines did not report any type of systematic review, cost-effectiveness review or decision model (NG68, NG64) that met the inclusion criteria. 167 documents from 43 NICE public health guidelines were systematic reviews of quantitative effectiveness, cost-effectiveness or decision model reports and met the inclusion criteria.
Narrative reviews of effectiveness were implemented in 41 (91%) of the NICE PH guidelines. 14 (31%) contained a review that used meta-analysis to synthesise the evidence. Only one (1%) NICE guideline contained a review that implemented NMA to synthesise the effectiveness of multiple interventions; this was the same guideline that used NMA in the original review and had been updated. 33 (73%) guidelines contained cost-effectiveness reviews and 34 (76%) developed a decision model.
Comparison of review types to original review
Table 2 compares the results of the update to the original review and shows that the types of reviews and evidence synthesis methodologies remain largely unchanged since 2012. The proportion of guidelines that only contain narrative reviews to synthesise effectiveness or cost-effectiveness evidence has reduced from 74% to 60% and the proportion that included a meta-analysis has increased from 23% to 31%. The proportion of guidelines with reviews that only included evidence from randomised controlled trials and assessed the quality of individual studies remained similar to the original review.
Characteristics of guidelines using meta-analytic methods
Table 3 details the characteristics of the meta-analytic methods implemented in 24 reviews of the 14 guidelines that included one. All of the reviews reported an assessment of study quality, 12 (50%) reviews included only data from randomised controlled trials, 4 (17%) reviews used intermediate outcomes (e.g. uptake of chlamydia screening rather than prevention of chlamydia (PH3)), compared to the 20 (83%) reviews that used final outcomes (e.g. smoking cessation rather than uptake of a smoking cessation programme (NG92)). 2 (8%) reviews only used a fixed effect meta-analysis, 19 (79%) reviews used a random effects meta-analysis and 3 (13%) did not report which they had used.
An evaluation of the intervention information reported in the reviews concluded that 12 (50%) reviews had lumped multiple (more than two) different interventions into a control versus intervention pairwise meta-analysis. Eleven (46%) of the reviews evaluated interventions that are made up of multiple components (e.g. interventions for preventing obesity in PH47 were made up of diet, physical activity and behavioural change components).
21 (88%) of the reviews presented the results of the meta-analysis in the form of a forest plot and 22 (92%) presented the results in the text of the report. 20 (83%) of the reviews used two or more forms of presentation for the results. Only three (13%) reviews assessed publication bias. The most common software to perform meta-analysis was RevMan in 14 (58%) of the reviews.
Reasons for not using meta-analytic methods
The 143 reviews of effectiveness and cost effectiveness that did not use meta-analysis methods to synthesise the quantitative effectiveness evidence were searched for reasons behind this decision. 70 reports (49%) did not give a reason for not synthesising the data using a meta-analysis and 164 reasons were reported which are displayed in Fig. 1. Out of the remaining reviews, multiple reasons for not using a meta-analysis were given. 53 (37%) of the reviews reported at least one reason due to heterogeneity. 30 (21%) decision model reports did not give a reason and these are categorised separately. 5 (3%) reviews reported that meta-analysis was not applicable or feasible, 1 (1%) reported that they were following NICE guidelines and 5 (3%) reported that there were a lack of studies.
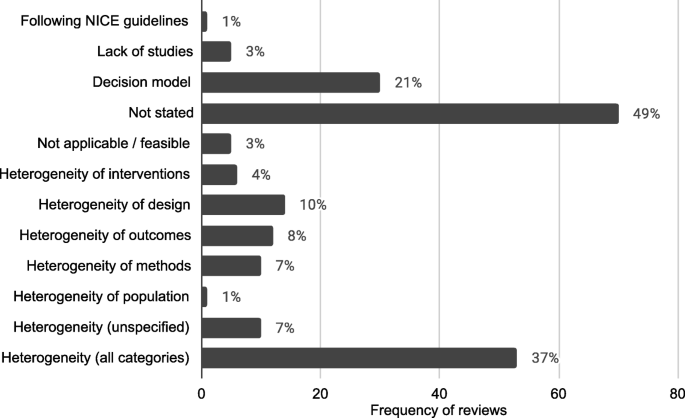
Frequency and proportions of reasons reported for not using statistical methods in quantitative evidence synthesis in NICE PH intervention reviews
The frequency of reviews and guidelines that used meta-analytic methods were plotted against year of publication, which is reported in Fig. 2. This showed that the number of reviews that used meta-analysis were approximately constant but there is some suggestion that the number of meta-analyses used per guideline increased, particularly in 2018.

Number of meta-analyses in NICE PH guidelines by year. Guidelines that were published before 2012 had been updated since the previous review by Achana et al. (2014) [3]
Comparison of meta-analysis characteristics to original review
Table 4 compares the characteristics of the meta-analyses used in the evidence synthesis of NICE public health intervention guidelines to the original review by Achana et al. (2014) [3]. Overall, the characteristics in the updated review have not much changed from those in the original. These changes demonstrate that the use of meta-analysis in NICE guidelines has increased but remains low. Lumping of interventions still appears to be common in 50% of reviews. The implications of this are discussed in the next section.
Application of evidence synthesis methodology in a public health intervention: motivating example
Since the original review, evidence synthesis methods have been developed and can address some of the challenges of synthesising quantitative effectiveness evidence of public health interventions. Despite this, the previous section shows that the uptake of these methods is still low in NICE public health guidelines - usually limited to a pairwise meta-analysis.
It has been shown in the results above and elsewhere [12] that heterogeneity is a common reason for not synthesising the quantitative effectiveness evidence available from systematic reviews in public health. Statistical heterogeneity is the variation in the intervention effects between the individual studies. Heterogeneity is problematic in evidence synthesis as it leads to uncertainty in the pooled effect estimates in a meta-analysis which can make it difficult to interpret the pooled results and draw conclusions. Rather than exploring the source of the heterogeneity, often in public health intervention appraisals a random effects model is fitted which assumes that the study intervention effects are not equivalent but come from a common distribution [13, 14]. Alternatively, as demonstrated in the review update, heterogeneity is used as a reason to not undertake any quantitative evidence synthesis at all.
Since the size of the intervention effects and the methodological variation in the studies will affect the impact of the heterogeneity on a meta-analysis, it is inappropriate to base the methodological approach of a review on the degree of heterogeneity, especially within public health intervention appraisal where heterogeneity seems inevitable. Ioannidis et al. (2008) argued that there are ‘almost always’ quantitative synthesis options that may offer some useful insights in the presence of heterogeneity, as long as the reviewers interpret the findings with respect to their limitations [12].
In this section current evidence synthesis methods are applied to a motivating example in public health. This aims to demonstrate that methods beyond pairwise meta-analysis can provide appropriate and pragmatic information to public health decision makers to enable more informed decision making.
Figure 3 summarises the narrative of this part of the paper and illustrates the methods that are discussed. The red boxes represent the challenges in synthesising quantitative effectiveness evidence and refers to the section within the paper for more detail. The blue boxes represent the methods that can be applied to investigate each challenge.

Summary of challenges that are faces in the evidence synthesis of public health interventions and methods that are discussed to overcome these challenges
Evaluating the effect of interventions for promoting the safe storage of cleaning products to prevent childhood poisoning accidents
To illustrate the methodological developments, a motivating example is used from the five year, NIHR funded, Keeping Children Safe Programme [15]. The project included a Cochrane systematic review that aimed to increase the use of safety equipment to prevent accidents at home in children under five years old. This application is intended to be illustrative of the benefits of new evidence synthesis methods since the previous review. It is not a complete, comprehensive analysis as it only uses a subset of the original dataset and therefore the results are not intended to be used for policy decision making. This example has been chosen as it demonstrates many of the issues in synthesising effectiveness evidence of public health interventions, including different study designs (randomised controlled trials, observational studies and cluster randomised trials), heterogeneity of populations or settings, incomplete individual participant data and complex interventions that contain multiple components.
This analysis will investigate the most effective promotional interventions for the outcome of ‘safe storage of cleaning products’ to prevent childhood poisoning accidents. There are 12 studies included in the dataset, with IPD available from nine of the studies. The covariate, single parent family, is included in the analysis to demonstrate the effect of being a single parent family on the outcome. In this example, all of the interventions are made up of one or more of the following components: education (Ed), free or low cost equipment (Eq), home safety inspection (HSI), and installation of safety equipment (In). A Bayesian approach using WinBUGS was used and therefore credible intervals (CrI) are presented with estimates of the effect sizes [16].
The original review paper by Achana et al. (2014) demonstrated pairwise meta-analysis and meta-regression using individual and cluster allocated trials, subgroup analyses, meta-regression using individual participant data (IPD) and summary aggregate data and NMA. This paper firstly applies NMA to the motivating example for context, followed by extensions to NMA.
Multiple interventions: lumping or splitting?
Often in public health there are multiple intervention options. However, interventions are often lumped together in a pairwise meta-analysis. Pairwise meta-analysis is a useful tool for two interventions or, alternatively in the presence of lumping interventions, for answering the research question: ‘are interventions in general better than a control or another group of interventions?’. However, when there are multiple interventions, this type of analysis is not appropriate for informing health care providers which intervention should be recommended to the public. ‘Lumping’ is becoming less frequent in other areas of evidence synthesis, such as for clinical interventions, as the use of sophisticated synthesis techniques, such as NMA, increases (Achana et al. 2014) but lumping is still common in public health.
NMA is an extension of the pairwise meta-analysis framework to more than two interventions. Multiple interventions that are lumped into a pairwise meta-analysis are likely to demonstrate high statistical heterogeneity. This does not mean that quantitative synthesis could not be undertaken but that a more appropriate method, NMA, should be implemented. Instead the statistical approach should be based on the research questions of the systematic review. For example, if the research question is ‘are any interventions effective for preventing obesity?’, it would be appropriate to perform a pairwise meta-analysis comparing every intervention in the literature to a control. However, if the research question is ‘which intervention is the most effective for preventing obesity?’, it would be more appropriate and informative to perform a network meta-analysis, which can compare multiple interventions simultaneously and identify the best one.
NMA is a useful statistical method in the context of public health intervention appraisal, where there are often multiple intervention options, as it estimates the relative effectiveness of three or more interventions simultaneously, even if direct study evidence is not available for all intervention comparisons. Using NMA can help to answer the research question ‘what is the effectiveness of each intervention compared to all other interventions in the network?’.
In the motivating example there are six intervention options. The effect of lumping interventions is shown in Fig. 4, where different interventions in both the intervention and control arms are compared. There is overlap of intervention and control arms across studies and interpretation of the results of a pairwise meta-analysis comparing the effectiveness of the two groups of interventions would not be useful in deciding which intervention to recommend. In comparison, the network plot in Fig. 5 illustrates the evidence base of the prevention of childhood poisonings review comparing six interventions that promote the use of safety equipment in the home. Most of the studies use ‘usual care’ as a baseline and compare this to another intervention. There are also studies in the evidence base that compare pairs of the interventions, such as ‘Education and equipment’ to ‘Equipment’. The plot also demonstrates the absence of direct study evidence between many pairs of interventions, for which the associated treatment effects can be indirectly estimated using NMA.

Network plot to illustrate how pairwise meta-analysis groups the interventions in the motivating dataset. Notation UC: Usual care, Ed: Education, Ed+Eq: Education and equipment, Ed+Eq+HSI: Education, equipment, and home safety inspection, Ed+Eq+In: Education, equipment and installation, Eq: Equipment

Network plot for the safe storage of cleaning products outcome. Notation UC: Usual care, Ed: Education, Ed+Eq: Education and equipment, Ed+Eq+HSI: Education, equipment, and home safety inspection, Ed+Eq+In: Education, equipment and installation, Eq: Equipment
An NMA was fitted to the motivating example to compare the six interventions in the studies from the review. The results are reported in the ‘triangle table’ in Table 5 [17]. The top right half of the table shows the direct evidence between pairs of the interventions in the corresponding rows and columns by either pooling the studies as a pairwise meta-analysis or presenting the single study results if evidence is only available from a single study. The bottom left half of the table reports the results of the NMA. The gaps in the top right half of the table arise where no direct study evidence exists to compare the two interventions. For example, there is no direct study evidence comparing ‘Education’ (Ed) to ‘Education, equipment and home safety inspection’ (Ed+Eq+HSI). The NMA, however, can estimate this comparison through the direct study evidence as an odds ratio of 3.80 with a 95% credible interval of (1.16, 12.44). The results suggest that the odds of safely storing cleaning products in the Ed+Eq+HSI intervention group is 3.80 times the odds in the Ed group. The results demonstrate a key benefit of NMA that all intervention effects in a network can be estimated using indirect evidence, even if there is no direct study evidence for some pairwise comparisons. This is based on the consistency assumption (that estimates of intervention effects from direct and indirect evidence are consistent) which should be checked when performing an NMA. This is beyond the scope of this paper and details on this can be found elsewhere [18].
NMA can also be used to rank the interventions in terms of their effectiveness and estimate the probability that each intervention is likely to be the most effective. This can help to answer the research question ‘which intervention is the best?’ out of all of the interventions that have provided evidence in the network. The rankings and associated probabilities for the motivating example are presented in Table 6. It can be seen that in this case the ‘education, equipment and home safety inspection’ (Ed+Eq+HSI) intervention is ranked first, with a 0.87 probability of being the best intervention. However, there is overlap of the 95% credible intervals of the median rankings. This overlap reflects the uncertainty in the intervention effect estimates and therefore it is important that the interpretation of these statistics clearly communicates this uncertainty to decision makers.
NMA has the potential to be extremely useful but is underutilised in the evidence synthesis of public health interventions. The ability to compare and rank multiple interventions in an area where there are often multiple intervention options is invaluable in decision making for identifying which intervention to recommend. NMA can also include further literature in the analysis, compared to a pairwise meta-analysis, by expanding the network to improve the uncertainty in the effectiveness estimates.
Statistical heterogeneity
When heterogeneity remains in the results of an NMA, it is useful to explore the reasons for this. Strategies for dealing with heterogeneity involve the inclusion of covariates in a meta-analysis or NMA to adjust for the differences in the covariates across studies [19]. Meta-regression is a statistical method developed from meta-analysis that includes covariates to potentially explain the between-study heterogeneity ‘with the aim of estimating treatment-covariate interactions’ (Saramago et al. 2012). NMA has been extended to network meta-regression which investigates the effect of trial characteristics on multiple intervention effects. Three ways have been suggested to include covariates in an NMA: single covariate effect, exchangeable covariate effects and independent covariate effects which are discussed in more detail in the NICE Technical Support Document 3 [14]. This method has the potential to assess the effect of study level covariates on the intervention effects, which is particularly relevant in public health due to the variation across studies.
The most widespread method of meta-regression uses study level data for the inclusion of covariates into meta-regression models. Study level covariate data is when the data from the studies are aggregated, e.g. the proportion of participants in a study that are from single parent families compared to dual parent families. The alternative to study level data is individual participant data (IPD), where the data are available and used as a covariate at the individual level e.g. the parental status of every individual in a study can be used as a covariate. Although IPD is considered to be the gold standard for meta-analysis, aggregated level data is much more commonly used as it is usually available and easily accessible from published research whereas IPD can be hard to obtain from study authors.
There are some limitations to network meta-regression. In our motivating example, using the single parent covariate in a meta-regression would estimate the relative difference in the intervention effects of a population that is made up of 100% single parent families compared to a population that is made up of 100% dual parent families. This interpretation is not as useful as the analysis that uses IPD, which would give the relative difference of the intervention effects in a single parent family compared to a dual parent family. The meta-regression using aggregated data would also be susceptible to ecological bias. Ecological bias is where the effect of the covariate is different at the study level compared to the individual level [14]. For example, if each study demonstrates a relationship between a covariate and the intervention but the covariate is similar across the studies, a meta-regression of the aggregate data would not demonstrate the effect that is observed within the studies [20].
Although meta-regression is a useful tool for investigating sources of heterogeneity in the data, caution should be taken when using the results of meta-regression to explain how covariates affect the intervention effects. Meta-regression should only be used to investigate study characteristics, such as the duration of intervention, which will not be susceptible to ecological bias and the interpretation of the results (the effect of intervention duration on intervention effectiveness) would be more meaningful for the development of public health interventions.
Since the covariate of interest in this motivating example is not a study characteristic, meta-regression of aggregated covariate data was not performed. Network meta-regression including IPD and aggregate level data was developed by Samarago et al. (2012) [21] to overcome the issues with aggregated data network meta-regression, which is discussed in the next section.
Tailored decision making to specific sub-groups
In public health it is important to identify which interventions are best for which people. There has been a recent move towards precision medicine. In the field of public health the ‘concept of precision prevention may [...] be valuable for efficiently targeting preventive strategies to the specific subsets of a population that will derive maximal benefit’ (Khoury and Evans, 2015). Tailoring interventions has the potential to reduce the effect of inequalities in social factors that are influencing the health of the population. Identifying which interventions should be targeted to which subgroups can also lead to better public health outcomes and help to allocate scarce NHS resources. Research interest, therefore, lies in identifying participant level covariate-intervention interactions.
IPD meta-analysis uses data at the individual level to overcome ecological bias. The interpretation of IPD meta-analysis is more relevant in the case of using participant characteristics as covariates since the interpretation of the covariate-intervention interaction is at the individual level rather than the study level. This means that it can answer the research question: ‘which interventions work best in subgroups of the population?’. IPD meta-analyses are considered to be the gold standard for evidence synthesis since it increases the power of the analysis to identify covariate-intervention interactions and it has the ability to reduce the effect of ecological bias compared to aggregated data alone. IPD meta-analysis can also help to overcome scarcity of data issues and has been shown to have higher power and reduce the uncertainty in the estimates compared to analysis including only summary aggregate data [22].
Despite the advantages of including IPD in a meta-analysis, in reality it is often very time consuming and difficult to collect IPD for all of the studies [21]. Although data sharing is becoming more common, it remains time consuming and difficult to collect IPD for all studies in a review. This results in IPD being underutilised in meta-analyses. As an intermediate solution, statistical methods have been developed, such as the NMA in Samarago et al. (2012), that incorporates both IPD and aggregate data. Methods that simultaneously include IPD and aggregate level data have been shown to reduce uncertainty in the effect estimates and minimise ecological bias [20, 21]. A simulation study by Leahy et al. (2018) found that an increased proportion of IPD resulted in more accurate and precise NMA estimates [23].
An NMA including IPD, where it is available, was performed, based on the model presented in Samarago et al. (2012) [21]. The results in Table 7 demonstrates the detail that this type of analysis can provide to base decisions on. More relevant covariate-intervention interaction interpretations can be obtained, for example the regression coefficients for covariate-intervention interactions are the individual level covariate intervention interactions or the ‘within study interactions’ that are interpreted as the effect of being in a single parent family on the effectiveness of each of the interventions. For example, the effect of Ed+Eq compared to UC in a single parent family is 1.66 times the effect of Ed+Eq compared to UC in a dual parent family but this is not an important difference as the credible interval crosses 1. The regression coefficients for the study level covariate-intervention interactions or the ‘between study interactions’ can be interpreted as the relative difference in the intervention effects of a population that is made up of 100% single parent families compared to a population that is made up of 100% dual parent families.
Complex interventions
In many public health research settings the complex interventions are comprised of a number of components. An NMA can compare all of the interventions in a network as they are implemented in the original trials. However, NMA does not tell us which components of the complex intervention are attributable to this effect. It could be that particular components, or the interacting effect of multiple components, are driving the effectiveness and other components are not as effective. Often, trials have not directly compared every combination of components as there are so many component combination options, it would be inefficient and impractical. Component NMA was developed by Welton et al. (2009) to estimate the effect of each component of the complex interventions and combination of components in a network, in the absence of direct trial evidence and answers the question: ‘are interventions with a particular component or combination of components effective?’ [11]. For example, for the motivating example, in comparison to Fig. 5, which demonstrates the interventions that an NMA can estimate effectiveness, Fig. 6 demonstrates all of the possible interventions of which the effectiveness can be estimated in a component NMA, given the components present in the network.

Network plot that illustrates how component network meta-analysis can estimate the effectiveness of intervention components and combinations of components, even when they are not included in the direct evidence. Notation UC: Usual care, Ed: Education, Eq: Equipment, Installation, Ed+Eq: Education and equipment, Ed+HSI: Education and home safety inspection, Ed+In: Education and installation, Eq+HSI: Equipment and home safety inspection, Eq+In: equipment and installation, HSI+In: Home safety inspection and installation, Ed+Eq+HSI: Education, equipment, and home safety inspection, Ed+Eq+In: Education, equipment and installation, Eq+HSI+In: Equipment, home safety inspection and installation, Ed+Eq+HSI+In: Education, equipment, home safety inspection and installation
The results of the analyses of the main effects, two way effects and full effects models are shown in Table 8. The models, proposed in the original paper by Welton et al. (2009), increase in complexity as the assumptions regarding the component effects relax [24]. The main effects component NMA assumes that the components in the interventions each have separate, independent effects and intervention effects are the sum of the component effects. The two-way effects models assumes that there are interactions between pairs of the components, so the effects of the interventions are more than the sum of the effects. The full effects model assumes that all of the components and combinations of the components interact. Component NMA did not provide further insight into which components are likely to be the most effective since all of the 95% credible intervals were very wide and overlapped 1. There is a lot of uncertainty in the results, particularly in the 2-way and full effects models. A limitation of component NMA is that there are issues with uncertainty when data is scarce. However, the results demonstrate the potential of component NMA as a useful tool to gain better insights from the available dataset.
In practice, this method has rarely been used since its development [24–26]. It may be challenging to define the components in some areas of public health where many interventions have been studied. However, the use of meta-analysis for planning future studies is rarely discussed and component NMA would provide a useful tool for identifying new component combinations that may be more effective [27]. This type of analysis has the potential to prioritise future public health research, which is especially useful where there are multiple intervention options, and identify more effective interventions to recommend to the public.
Further methods / other outcomes
The analysis and methods described in this paper only cover a small subset of the methods that have been developed in meta-analysis in recent years. Methods that aim to assess the quality of evidence supporting a NMA and how to quantify how much the evidence could change due to potential biases or sampling variation before the recommendation changes have been developed [28, 29]. Models adjusting for baseline risk have been developed to allow for different study populations to have different levels of underlying risk, by using the observed event rate in the control arm [30, 31]. Multivariate methods can be used to compare the effect of multiple interventions on two or more outcomes simultaneously [32]. This area of methodological development is especially appealing within public health where studies assess a broad range of health effects and typically have multiple outcome measures. Multivariate methods offer benefits over univariate models by allowing the borrowing of information across outcomes and modelling the relationships between outcomes which can potentially reduce the uncertainty in the effect estimates [33]. Methods have also been developed to evaluate interventions with classes or different intervention intensities, known as hierarchical interventions [34]. These methods were not demonstrated in this paper but can also be useful tools for addressing challenges of appraising public health interventions, such as multiple and surrogate outcomes.
This paper only considered an example with a binary outcome. All of the methods described have also been adapted for other outcome measures. For example, the Technical Support Document 2 proposed a Bayesian generalised linear modelling framework to synthesise other outcome measures. More information and models for continuous and time-to-event data is available elsewhere [21, 35–38].
Software and guidelines
In the previous section, meta-analytic methods that answer more policy relevant questions were demonstrated. However, as shown by the update to the review, methods such as these are still under-utilised. It is suspected from the NICE public health review that one of the reasons for the lack of uptake of methods in public health could be due to common software choices, such as RevMan, being limited in their flexibility for statistical methods.
Table 9 provides a list of software options and guidance documents that are more flexible than RevMan for implementing the statistical methods illustrated in the previous section to make these methods more accessible to researchers.
In this paper, the network plot in Figs. 5 and 6 were produced using the networkplot command from the mvmeta package [39] in Stata [61]. WinBUGS was used to fit the NMA in this paper by adapting the code in the book ‘Evidence Synthesis for Decision Making in Healthcare’ which also provides more detail on Bayesian methods and assessing convergence of Bayesian models [45]. The model for including IPD and summary aggregate data in an NMA was based on the code in the paper by Saramago et al. (2012). The component NMA in this paper was performed in WinBUGS through R2WinBUGS, [47] using the code in Welton et al. (2009) [11].
WinBUGS is a flexible tool for fitting complex models in a Bayesian framework. The NICE Decision Support Unit produced a series of Evidence Synthesis Technical Support Documents [46] that provide a comprehensive technical guide to methods for evidence synthesis and WinBUGS code is also provided for many of the models. Complex models can also be performed in a frequentist framework. Code and commands for many models are available in R and STATA (see Table 9).
The software, R2WinBUGS, was used in the analysis of the motivating example. Increasing numbers of researchers are using R and so packages that can be used to link the two softwares by calling BUGS models in R, packages such as R2WinBUGS, can improve the accessibility of Bayesian methods [47]. The new R package, BUGSnet, may also help to facilitate the accessibility and improve the reporting of Bayesian NMA [48]. Webtools have also been developed as a means of enabling researchers to undertake increasingly complex analyses [52, 53]. Webtools provide a user-friendly interface to perform statistical analyses and often help in the reporting of the analyses by producing plots, including network plots and forest plots. These tools are very useful for researchers that have a good understanding of the statistical methods they want to implement as part of their review but are inexperienced in statistical software.
Discussion
This paper has reviewed NICE public health intervention guidelines to identify the methods that are currently being used to synthesise effectiveness evidence to inform public health decision making. A previous review from 2012 was updated to see how method utilisation has changed. Methods have been developed since the previous review and these were applied to an example dataset to show how methods can answer more policy relevant questions. Resources and guidelines for implementing these methods were signposted to encourage uptake.
The review found that the proportion of NICE guidelines containing effectiveness evidence summarised using meta-analysis methods has increased since the original review, but remains low. The majority of the reviews presented only narrative summaries of the evidence - a similar result to the original review. In recent years, there has been an increased awareness of the need to improve decision making by using all of the available evidence. As a result, this has led to the development of new methods, easier application in standard statistical software packages, and guidance documents. Based on this, it would have been expected that their implementation would rise in recent years to reflect this, but the results of the review update showed no such increasing pattern.
A high proportion of NICE guideline reports did not provide a reason for not applying quantitative evidence synthesis methods. Possible explanations for this could be time or resource constraints, lack of statistical expertise, being unaware of the available methods or poor reporting. Reporting guidelines, such as the Preferred Reporting Items for Systematic Reviews and Meta-Analyses (PRISMA), should be updated to emphasise the importance of documenting reasons for not applying methods, as this can direct future research to improve uptake.
Where it was specified, the most common reported reason for not conducting a meta-analysis was heterogeneity. Often in public health, the data is heterogeneous due to the differences between studies in population, design, interventions or outcomes. A common misconception is that the presence of heterogeneity implies that it is not possible to pool the data. Meta-analytic methods can be used to investigate the sources of heterogeneity, as demonstrated in the NMA of the motivating example, and the use of IPD is recommended where possible to improve the precision of the results and reduce the effect of ecological bias. Although caution should be exercised in the interpretation of the results, quantitative synthesis methods provide a stronger basis for making decisions than narrative accounts because they explicitly quantify the heterogeneity and seek to explain it where possible.
The review also found that the most common software to perform the synthesis was RevMan. RevMan is very limited in its ability to perform advanced statistical analyses, beyond that of pairwise meta-analysis, which might explain the above findings. Standard software code is being developed to help make statistical methodology and application more accessible and guidance documents are becoming increasingly available.
The evaluation of public health interventions can be problematic due to the number and complexity of the interventions. NMA methods were applied to a real Cochrane public health review dataset. The methods that were demonstrated showed ways to address some of these issues, including the use of NMA for multiple interventions, the inclusion of covariates as both aggregated data and IPD to explain heterogeneity, and the extension to component network meta-analysis for guiding future research. These analyses illustrated how the choice of synthesis methods can enable more informed decision making by allowing more distinct interventions, and combinations of intervention components, to be defined and their effectiveness estimated. It also demonstrated the potential to target interventions to population subgroups where they are likely to be most effective. However, the application of component NMA to the motivating example has also demonstrated the issues around uncertainty if there are a limited number of studies observing the interventions and intervention components.
The application of methods to the motivating example demonstrated a key benefit of using statistical methods in a public health context compared to only presenting a narrative review – the methods provide a quantitative estimate of the effectiveness of the interventions. The uncertainty from the credible intervals can be used to demonstrate the lack of available evidence. In the context of decision making, having pooled estimates makes it much easier for decision makers to assess the effectiveness of the interventions or identify when more research is required. The posterior distribution of the pooled results from the evidence synthesis can also be incorporated into a comprehensive decision analytic model to determine cost-effectiveness [62]. Although narrative reviews are useful for describing the evidence base, the results are very difficult to summarise in a decision context.
Although heterogeneity seems to be inevitable within public health interventions due to their complex nature, this review has shown that it is still the main reported reason for not using statistical methods in evidence synthesis. This may be due to guidelines that were originally developed for clinical treatments that are tested in randomised conditions still being applied in public health settings. Guidelines for the choice of methods used in public health intervention appraisals could be updated to take into account the complexities and wide ranging areas in public health. Sophisticated methods may be more appropriate in some cases than simpler models for modelling multiple, complex interventions and their uncertainty, given the limitations are also fully reported [19]. Synthesis may not be appropriate if statistical heterogeneity remains after adjustment for possible explanatory covariates but details of exploratory analysis and reasons for not synthesising the data should be reported. Future research should focus on the application and dissemination of the advantages of using more advanced methods in public health, identifying circumstances where these methods are likely to be the most beneficial, and ways to make the methods more accessible, for example, the development of packages and web tools.
Conclusions
There is an evident need to facilitate the translation of the synthesis methods into a public health context and encourage the use of methods to improve decision making. This review has shown that the uptake of statistical methods for evaluating the effectiveness of public health interventions is slow, despite advances in methods that address specific issues in public health intervention appraisal and the publication of guidance documents to complement their application.
Availability of data and materials
The dataset supporting the conclusions of this article is included within the article.
Abbreviations
- NICE:
-
National institute for health and care excellence
- NMA:
-
Network meta-analysis
- IPD:
-
Individual participant data
- Ed:
-
Education
- HSI:
-
Home safety inspection
- In:
-
Installation
- Eq:
-
Equipment
- CrI:
-
Credible interval
- PRISMA:
-
Preferred reporting items for systematic reviews and meta-analyses
References
Dias S, Welton NJ, Sutton AJ, Ades A. NICE DSU Technical Support Document 2: A Generalised Linear Modelling Framework for Pairwise and Network Meta-Analysis of Randomised Controlled Trials: National Institute for Health and Clinical Excellence; 2011, p. 98. (Technical Support Document in Evidence Synthesis; TSD2).
Higgins JPT, López-López JA, Becker BJ, et al.Synthesising quantitative evidence in systematic reviews of complex health interventions. BMJ Global Health. 2019; 4(Suppl 1):e000858. https://doi.org/10.1136/bmjgh-2018-000858.
Achana F, Hubbard S, Sutton A, Kendrick D, Cooper N. An exploration of synthesis methods in public health evaluations of interventions concludes that the use of modern statistical methods would be beneficial. J Clin Epidemiol. 2014; 67(4):376–90.
Craig P, Dieppe P, Macintyre S, Michie S, Nazareth I, Petticrew M. Developing and evaluating complex interventions: the new medical research council guidance. Int J Nurs Stud. 2013; 50(5):587–92.
Caldwell DM, Welton NJ. Approaches for synthesising complex mental health interventions in meta-analysis. Evidence-Based Mental Health. 2016; 19(1):16–21.
Melendez-Torres G, Bonell C, Thomas J. Emergent approaches to the meta-analysis of multiple heterogeneous complex interventions. BMC Med Res Methodol. 2015; 15(1):47.
NICE. NICE: Who We Are. https://www.nice.org.uk/about/who-we-are. Accessed 19 Sept 2019.
Kelly M, Morgan A, Ellis S, Younger T, Huntley J, Swann C. Evidence based public health: a review of the experience of the national institute of health and clinical excellence (NICE) of developing public health guidance in England. Soc Sci Med. 2010; 71(6):1056–62.
NICE. Developing NICE Guidelines: The Manual. https://www.nice.org.uk/process/pmg20/chapter/introduction-and-overview. Accessed 19 Sept 2019.
NICE. Public Health Guidance. https://www.nice.org.uk/guidance/published?type=ph. Accessed 19 Sept 2019.
Welton NJ, Caldwell D, Adamopoulos E, Vedhara K. Mixed treatment comparison meta-analysis of complex interventions: psychological interventions in coronary heart disease. Am J Epidemiol. 2009; 169(9):1158–65.
Ioannidis JP, Patsopoulos NA, Rothstein HR. Reasons or excuses for avoiding meta-analysis in forest plots. BMJ. 2008; 336(7658):1413–5.
Higgins JP, Thompson SG. Quantifying heterogeneity in a meta-analysis. Stat Med. 2002; 21(11):1539–58.
Dias S, Sutton A, Welton N, Ades A. NICE DSU Technical Support Document 3: Heterogeneity: Subgroups, Meta-Regression, Bias and Bias-Adjustment: National Institute for Health and Clinical Excellence; 2011, p. 76.
Kendrick D, Ablewhite J, Achana F, et al.Keeping Children Safe: a multicentre programme of research to increase the evidence base for preventing unintentional injuries in the home in the under-fives. Southampton: NIHR Journals Library; 2017.
Lunn DJ, Thomas A, Best N, et al.WinBUGS - A Bayesian modelling framework: Concepts, structure, and extensibility. Stat Comput. 2000; 10:325–37. https://doi.org/10.1023/A:1008929526011.
Dias S, Caldwell DM. Network meta-analysis explained. Arch Dis Child Fetal Neonatal Ed. 2019; 104(1):8–12. https://doi.org/10.1136/archdischild-2018-315224. http://arxiv.org/abs/https://fn.bmj.com/content/104/1/F8.full.pdf.
Dias S, Welton NJ, Sutton AJ, Caldwell DM, Lu G, Ades A. NICE DSU Technical Support Document 4: Inconsistency in Networks of Evidence Based on Randomised Controlled Trials: National Institute for Health and Clinical Excellence; 2011. (NICE DSU Technical Support Document in Evidence Synthesis; TSD4).
Cipriani A, Higgins JP, Geddes JR, Salanti G. Conceptual and technical challenges in network meta-analysis. Ann Intern Med. 2013; 159(2):130–7.
Riley RD, Steyerberg EW. Meta-analysis of a binary outcome using individual participant data and aggregate data. Res Synth Methods. 2010; 1(1):2–19.
Saramago P, Sutton AJ, Cooper NJ, Manca A. Mixed treatment comparisons using aggregate and individual participant level data. Stat Med. 2012; 31(28):3516–36.
Lambert PC, Sutton AJ, Abrams KR, Jones DR. A comparison of summary patient-level covariates in meta-regression with individual patient data meta-analysis. J Clin Epidemiol. 2002; 55(1):86–94.
Leahy J, O’Leary A, Afdhal N, Gray E, Milligan S, Wehmeyer MH, Walsh C. The impact of individual patient data in a network meta-analysis: an investigation into parameter estimation and model selection. Res Synth Methods. 2018; 9(3):441–69.
Freeman SC, Scott NW, Powell R, Johnston M, Sutton AJ, Cooper NJ. Component network meta-analysis identifies the most effective components of psychological preparation for adults undergoing surgery under general anesthesia. J Clin Epidemiol. 2018; 98:105–16.
Pompoli A, Furukawa TA, Efthimiou O, Imai H, Tajika A, Salanti G. Dismantling cognitive-behaviour therapy for panic disorder: a systematic review and component network meta-analysis. Psychol Med. 2018; 48(12):1945–53.
Rücker G, Schmitz S, Schwarzer G. Component network meta-analysis compared to a matching method in a disconnected network: A case study. Biom J. 2020. https://doi.org/10.1002/bimj.201900339.
Efthimiou O, Debray TP, van Valkenhoef G, Trelle S, Panayidou K, Moons KG, Reitsma JB, Shang A, Salanti G, Group GMR. GetReal in network meta-analysis: a review of the methodology. Res Synth Methods. 2016; 7(3):236–63.
Salanti G, Del Giovane C, Chaimani A, Caldwell DM, Higgins JP. Evaluating the quality of evidence from a network meta-analysis. PLoS ONE. 2014; 9(7):99682.
Phillippo DM, Dias S, Welton NJ, Caldwell DM, Taske N, Ades A. Threshold analysis as an alternative to grade for assessing confidence in guideline recommendations based on network meta-analyses. Ann Intern Med. 2019; 170(8):538–46.
Dias S, Welton NJ, Sutton AJ, Ades AE. NICE DSU Technical Support Document 5: Evidence Synthesis in the Baseline Natural History Model: National Institute for Health and Clinical Excellence; 2011, p. 29. (NICE DSU Technical Support Document in Evidence Synthesis; TSD5).
Achana FA, Cooper NJ, Dias S, Lu G, Rice SJ, Kendrick D, Sutton AJ. Extending methods for investigating the relationship between treatment effect and baseline risk from pairwise meta-analysis to network meta-analysis. Stat Med. 2013; 32(5):752–71.
Riley RD, Jackson D, Salanti G, Burke DL, Price M, Kirkham J, White IR. Multivariate and network meta-analysis of multiple outcomes and multiple treatments: rationale, concepts, and examples. BMJ (Clinical research ed.) 2017; 358:j3932. https://doi.org/10.1136/bmj.j3932.
Achana FA, Cooper NJ, Bujkiewicz S, Hubbard SJ, Kendrick D, Jones DR, Sutton AJ. Network meta-analysis of multiple outcome measures accounting for borrowing of information across outcomes. BMC Med Res Methodol. 2014; 14(1):92.
Owen RK, Tincello DG, Keith RA. Network meta-analysis: development of a three-level hierarchical modeling approach incorporating dose-related constraints. Value Health. 2015; 18(1):116–26.
Jansen JP. Network meta-analysis of individual and aggregate level data. Res Synth Methods. 2012; 3(2):177–90.
Donegan S, Williamson P, D’Alessandro U, Garner P, Smith CT. Combining individual patient data and aggregate data in mixed treatment comparison meta-analysis: individual patient data may be beneficial if only for a subset of trials. Stat Med. 2013; 32(6):914–30.
Saramago P, Chuang L-H, Soares MO. Network meta-analysis of (individual patient) time to event data alongside (aggregate) count data. BMC Med Res Methodol. 2014; 14(1):105.
Thom HH, Capkun G, Cerulli A, Nixon RM, Howard LS. Network meta-analysis combining individual patient and aggregate data from a mixture of study designs with an application to pulmonary arterial hypertension. BMC Med Res Methodol. 2015; 15(1):34.
Gasparrini A, Armstrong B, Kenward MG. Multivariate meta-analysis for non-linear and other multi-parameter associations. Stat Med. 2012; 31(29):3821–39.
Chaimani A, Higgins JP, Mavridis D, Spyridonos P, Salanti G. Graphical tools for network meta-analysis in stata. PLoS ONE. 2013; 8(10):76654.
Rücker G, Schwarzer G, Krahn U, König J. netmeta: Network meta-analysis with R. R package version 0.5-0. 2014. R package version 0.5-0. Availiable: http://CRAN.R-project.org/package=netmeta.
van Valkenhoef G, Kuiper J. gemtc: Network Meta-Analysis Using Bayesian Methods. R package version 0.8-2. 2016. Available online at: https://CRAN.R-project.org/package=gemtc.
Lin L, Zhang J, Hodges JS, Chu H. Performing arm-based network meta-analysis in R with the pcnetmeta package. J Stat Softw. 2017; 80(5):1–25. https://doi.org/10.18637/jss.v080.i05.
Rücker G, Schwarzer G. Automated drawing of network plots in network meta-analysis. Res Synth Methods. 2016; 7(1):94–107.
Welton NJ, Sutton AJ, Cooper N, Abrams KR, Ades A. Evidence Synthesis for Decision Making in Healthcare, vol. 132. UK: Wiley; 2012.
Dias S, Welton NJ, Sutton AJ, Ades AE. Evidence synthesis for decision making 1: introduction. Med Decis Making Int J Soc Med Decis Making. 2013; 33(5):597–606. https://doi.org/10.1177/0272989X13487604.
Sturtz S, Ligges U, Gelman A. R2WinBUGS: a package for running WinBUGS from R. J Stat Softw. 2005; 12(3):1–16.
Béliveau A, Boyne DJ, Slater J, Brenner D, Arora P. Bugsnet: an r package to facilitate the conduct and reporting of bayesian network meta-analyses. BMC Med Res Methodol. 2019; 19(1):196.
Neupane B, Richer D, Bonner AJ, Kibret T, Beyene J. Network meta-analysis using R: a review of currently available automated packages. PLoS ONE. 2014; 9(12):115065.
White IR. Multivariate random-effects meta-analysis. Stata J. 2009; 9(1):40–56.
Chaimani A, Salanti G. Visualizing assumptions and results in network meta-analysis: the network graphs package. Stata J. 2015; 15(4):905–50.
Owen RK, Bradbury N, Xin Y, Cooper N, Sutton A. MetaInsight: An interactive web-based tool for analyzing, interrogating, and visualizing network meta-analyses using R-shiny and netmeta. Res Synth Methods. 2019; 10(4):569–81. https://doi.org/10.1002/jrsm.1373.
Freeman SC, Kerby CR, Patel A, Cooper NJ, Quinn T, Sutton AJ. Development of an interactive web-based tool to conduct and interrogate meta-analysis of diagnostic test accuracy studies: MetaDTA. BMC Med Res Methodol. 2019; 19(1):81.
Nikolakopoulou A, Higgins JPT, Papakonstantinou T, Chaimani A, Del Giovane C, Egger M, Salanti G. CINeMA: An approach for assessing confidence in the results of a network meta-analysis. PLoS Med. 2020; 17(4):e1003082. https://doi.org/10.1371/journal.pmed.1003082.
Viechtbauer W. Conducting meta-analyses in R with the metafor package. J Stat Softw. 2010; 36(3):1–48.
Freeman SC, Carpenter JR. Bayesian one-step ipd network meta-analysis of time-to-event data using royston-parmar models. Res Synth Methods. 2017; 8(4):451–64.
Riley RD, Lambert PC, Staessen JA, Wang J, Gueyffier F, Thijs L, Boutitie F. Meta-analysis of continuous outcomes combining individual patient data and aggregate data. Stat Med. 2008; 27(11):1870–93.
Debray TP, Moons KG, van Valkenhoef G, Efthimiou O, Hummel N, Groenwold RH, Reitsma JB, Group GMR. Get real in individual participant data (ipd) meta-analysis: a review of the methodology. Res Synth Methods. 2015; 6(4):293–309.
Tierney JF, Vale C, Riley R, Smith CT, Stewart L, Clarke M, Rovers M. Individual Participant Data (IPD) Meta-analyses of Randomised Controlled Trials: Guidance on Their Use. PLoS Med. 2015; 12(7):e1001855. https://doi.org/10.1371/journal.pmed.1001855.
Stewart LA, Clarke M, Rovers M, Riley RD, Simmonds M, Stewart G, Tierney JF. Preferred reporting items for a systematic review and meta-analysis of individual participant data: the prisma-ipd statement. JAMA. 2015; 313(16):1657–65.
StataCorp. Stata Statistical Software: Release 16. College Station: StataCorp LLC; 2019.
Cooper NJ, Sutton AJ, Abrams KR, Turner D, Wailoo A. Comprehensive decision analytical modelling in economic evaluation: a bayesian approach. Health Econ. 2004; 13(3):203–26.
Acknowledgements
We would like to acknowledge Professor Denise Kendrick as the lead on the NIHR Keeping Children Safe at Home Programme that originally funded the collection of the evidence for the motivating example and some of the analyses illustrated in the paper.
Funding
ES is funded by a National Institute for Health Research (NIHR), Doctoral Research Fellow for this research project. This paper presents independent research funded by the National Institute for Health Research (NIHR). The views expressed are those of the authors and not necessarily those of the NHS, the NIHR or the Department of Health and Social Care. The funding bodies played no role in the design of the study and collection, analysis, and interpretation of data and in writing the manuscript.
Author information
Authors and Affiliations
Contributions
ES performed the review, analysed the data and wrote the paper. SH supervised the project. SH, KA, NC and AS provided substantial feedback on the manuscript. All authors have read and approved the manuscript.
Corresponding author
Ethics declarations
Ethics approval and consent to participate
Not applicable.
Consent for publication
Not applicable.
Competing interests
KA is supported by Health Data Research (HDR) UK, the UK National Institute for Health Research (NIHR) Applied Research Collaboration East Midlands (ARC EM), and as a NIHR Senior Investigator Emeritus (NF-SI-0512-10159). The views expressed are those of the author(s) and not necessarily those of the NIHR or the Department of Health and Social Care. KA has served as a paid consultant, providing unrelated methodological advice, to; Abbvie, Amaris, Allergan, Astellas, AstraZeneca, Boehringer Ingelheim, Bristol-Meyers Squibb, Creativ-Ceutical, GSK, ICON/Oxford Outcomes, Ipsen, Janssen, Eli Lilly, Merck, NICE, Novartis, NovoNordisk, Pfizer, PRMA, Roche and Takeda, and has received research funding from Association of the British Pharmaceutical Industry (ABPI), European Federation of Pharmaceutical Industries & Associations (EFPIA), Pfizer, Sanofi and Swiss Precision Diagnostics. He is a Partner and Director of Visible Analytics Limited, a healthcare consultancy company.
Additional information
Publisher’s Note
Springer Nature remains neutral with regard to jurisdictional claims in published maps and institutional affiliations.
Supplementary Information
Additional file 1
Key for the Nice public health guideline codes. Available in NICEGuidelinesKey.xlsx.
Additional file 2
NICE public health intervention guideline review flowchart for the inclusion and exclusion of documents. Available in Flowchart.JPG.
Rights and permissions
Open Access This article is licensed under a Creative Commons Attribution 4.0 International License, which permits use, sharing, adaptation, distribution and reproduction in any medium or format, as long as you give appropriate credit to the original author(s) and the source, provide a link to the Creative Commons licence, and indicate if changes were made. The images or other third party material in this article are included in the article’s Creative Commons licence, unless indicated otherwise in a credit line to the material. If material is not included in the article’s Creative Commons licence and your intended use is not permitted by statutory regulation or exceeds the permitted use, you will need to obtain permission directly from the copyright holder. To view a copy of this licence, visit http://creativecommons.org/licenses/by/4.0/. The Creative Commons Public Domain Dedication waiver (http://creativecommons.org/publicdomain/zero/1.0/) applies to the data made available in this article, unless otherwise stated in a credit line to the data.
About this article

Cite this article
Smith, E.A., Cooper, N.J., Sutton, A.J. et al. A review of the quantitative effectiveness evidence synthesis methods used in public health intervention guidelines. BMC Public Health 21, 278 (2021). https://doi.org/10.1186/s12889-021-10162-8
Received:
Accepted:
Published:
DOI: https://doi.org/10.1186/s12889-021-10162-8