- Research article
- Open access
- Published:
Changes in sedentary behaviour in European Union adults between 2002 and 2017
BMC Public Health volume 20, Article number: 1206 (2020)
Abstract
Background
Sedentary behaviour (SB) has been identified as an important mortality risk factor. Health organizations have recognised SB as a public health challenge with major health, social, and economic consequences. Researchers have alerted the need to develop specific strategies, to monitor, prevent, and reduce SB. However, there is no systematic analysis of the SB changes in European Union adults. We aimed to examine SB changes between 2002 and 2017 in the European Union (EU) adult population.
Methods
SB prevalence (>4h30mins of sitting time/day) of 96,004 adults as a whole sample and country-by-country was analysed in 2002, 2005, 2013, and 2017 of the Sport and Physical Activity EU Special Eurobarometers’ data. The SB question of a modified version of the International Physical Activity Questionnaire was considered. SB prevalence between countries and within years was analysed with a χ2 test, and SB between genders was analysed with the Z-Score test for two population proportions.
Results
An association between the SB prevalence and the years was found (p < 0.001), with increases for the whole sample (2002: 49.3%, 48.5–50.0 95% confidence interval (CI); 2017: 54.5%, 53.9–55.0 95% CI) and men (2002: 51.2%, 50.0–52.4 95% CI; 2017: 55.8%, 55.0–56.7 95% CI) and women (2002: 47.6%, 46.6–48.7 95% CI; 2017: 53.4%, 52.6–54.1 95% CI) separately. The adjusted standardised residuals showed an increase in the observed prevalence versus the expected during 2013 and 2017 for the whole sample and women and during 2017 for men. For all years, differences were observed in the SB prevalence between countries for the whole sample, and men and women separately (p < 0.001). Besides, the SB prevalence was always higher in men versus women in the overall EU sample (p < 0.001).
Conclusions
SB prevalence increased between 2002 and 2017 for the EU as a whole and for both sexes separately. Additionally, differences in SB prevalence were observed for all years between EU countries in the whole sample and both sexes separately. Lastly, SB was consistently higher in men than women. These findings reveal a limited impact of current policies and interventions to tackle SB at the EU population level.
Background
Sedentary behaviour (SB) is defined as any waking behaviour characterised by an energy expenditure ≤1.5 metabolic equivalents (METs), while in a sitting, reclining, or lying posture [1]. SB has increased in the industrialised countries in the last decades, with the average adult spending more than half of the day in a SB [2]. This negative lifestyle change presents a major risk factor in the development of many chronic diseases such as obesity, type 2 diabetes, hypertension, cancers, and even premature death [2,3,4,5]. In this regard, SB is one of the most important causes of death in developed countries [6]. In European countries, the proportion of deaths attributable to sitting time, a general proxy for SB, is 4.4%, or more than 230,000 deaths/year [7]. Considering this, SB has come to be a major health threat in modern society [8], and awareness of the health and economic burden of SB to policymakers is, therefore, paramount. Men are more frequently sedentary than women [9,10,11], and independently of the physical activity (PA) performed, SB has negative consequences when sustained for long uninterrupted periods of time [2, 12,13,14].
The promotion of PA has received substantial and increasing attention globally, with myriad recommendations and plans in circulation [15,16,17]. By comparison, SB has received limited attention [18]. Previous studies showed that complying with the global recommendations of PA was insufficient to eliminate the increased risk of premature death as a consequence of a high SB (e.g., number of sitting hours) [3, 19], unless the PA occurs at a considerable volume [3, 19], which is difficult to achieve for most of the population. Moreover, Patterson et al. [5] report that the risk of chronic disease associated with SB is not reduced regardless of meeting the recommended PA guidelines. As a consequence, a separate, but equally important focus is required on interventions that help reduce or break-up SB and on public health policy to drive change in SB at a population level [19].
Given the scale of the problem, the World Health Organization (WHO) released a report in 2002, in which it requested countries to develop population-level health promotion strategies to reduce high levels of physical inactivity and sedentary lifestyle. However, there was only a recommendation addressing SB and no specific targets, strategies, or key performance indicators [20].
Since 2002, systematic surveys have been administered to the European Union (EU) member states to monitor SB prevalence with self-report data gathered from the International Questionnaire of Physical Activity (IPAQ) short form. Several studies have analysed SB in these Eurobarometers in a particular year (e.g., 2002 [21], 2005 [9], and 2013 [10, 22]), or as trend data between years [23, 24]. Milton et al., [24] suggested that SB decreased across the EU from 2002 to 2013, while Jelsma et al. (2019) reported that SB was relatively stable over a 15-year period. However, the implication of this time trend analysis was limited by a change in the sitting question included in the Eurobarometer survey between 2005 and 2013 [23, 24]. Each of these studies used the same criteria to determine SB (i.e., >7h30mins), which is typically considered a ‘high’ amount of SB. Therefore, individuals with middle amounts of daily SB (4h31min-7h30mins) were not included. Milton et al. (2015) data showed that merging these two groups increased SB from 51.9% in 2002 to 53% in 2013 [24]. From a public health perspective, it is essential to consider individuals already exceeding 4h30min per day as that is the accepted cut-point resulting in an increased risk of having cardiovascular diseases [25,26,27] or suffering cardiovascular disease mortality events [28].
With this in mind, is paramount to understand the importance of trends in SB across the EU during the last 15 years, including those who exceed 4h30min/day. Furthermore, data is required to determine the plausible impact of policy development on SB behaviour between those years [29, 30]. This is especially relevant since, through the WHO’s Global Action Plans, it is continued to emphasise the need for strengthening the systems required to implement effective and coordinated actions aiming to reduce SB [16, 17]. A global understanding of SB trends would inform new and update existing policy and position statements in alignment with the recommendations in the global action plan [16, 17].
The primary aim of this study was to identify changes in SB between 2002 and 2017 in EU adults, analysing four separate Sport and Physical Activity Eurobarometer’s data. For this, we analysed the SB prevalence (>4h30mins of sitting time/day), considering the between-country differences for all years and the changes within-country between years for the total sample and split by gender. The likely changes were compared against the EU countries’ plans to prevent or reduce SB.
Methods
Data source
The European Commission conducts public opinion surveys simultaneously on all EU state members to inquire about the levels of PA, sports participation, and SB among its citizens. These surveys were conducted in 2002, 2005, 2013, and 2017 through the Sport and Physical Activity and Health and Food Special Eurobarometer’s.
For this study, data were obtained from the adult European population (18–99 years old) of four successive Eurobarometer surveys; December 2002 (Special Eurobarometer 183.6; n = 15,363), December 2005 (Special Eurobarometer 246; n = 26,413), December 2013 (Special Eurobarometer 412; n = 26,988), and December 2017 (Special Eurobarometer 472; n = 27,240), with a final sample of n = 96,004 (42,546 men and 53,458 women) from the 28 European Union member countries (Austria, Belgium, Bulgaria, Czech Republic, Croatia, Cyprus Republic, Denmark, Estonia, Finland, France, Germany [combined West and East Deutschland], Great Britain, Greece, Hungary, Ireland, Italy, Latvia, Lithuania, Luxembourg, Malta, Netherlands, Poland, Portugal, Romania, Slovakia, Slovenia, Spain, and Sweden). Data from Northern Cyprus and Turkey were not analysed because they do not belong to the EU member countries. Northern Ireland was also not considered due to its unique characteristics.
Eurobarometers use a multi-stage sampling design where primary sampling units are selected from each of the administrative regions in every country. The primary sampling unit’s selection is proportional to the population size of every country, from sampling frames stratified by the degree of urbanization. In this regard, gender, age, region, and the size of the locality were introduced in the iteration procedure. All interviews are conducted face-to-face in people’s homes in their national language [31, 32].
Measures
The IPAQ is a valid and reliable questionnaire to obtain data on SB [33]. In addition to light, moderate, and vigorous PA, the IPAQ short-form records the total time sitting on an average day as a proxy for SB (i.e., How much time do you spend sitting on a usual day? This may include time spent at a desk, visiting friends, studying or watching television?). In the 2002 and 2005 surveys, EU citizens were asked to estimate their usual weekday sitting time using an open-ended response scale. For the 2013 and 2017 surveys, EU citizens were given a choice of 11 categorical response options, ranging from ‘≤ 60 mins’ to ‘>8h30mins’. For this study, to establish a standard measure of SB prevalence in the EU adult population, a cut-off point of 4 h and 30 min was used to define SB (i.e., from ‘>4h30mins’ to ‘> 8h30mins’), as these values show a higher risk of death due to cardiovascular diseases [3, 28]. Furthermore, the close answers in 2013 and 2017 in Eurobarometers did not allow for calculating time spent in SB in relation to other epidemiologic studies, so levels of SB were adapted to these particular categories (i.e., ‘>4h30mins’ and beyond), as Milton et al. (2015) [24]. Individuals answering ‘don’t know’ were included in the analysis.
Statistical analysis
Descriptive statistics presented as a proportion (%) with the 95% confidence interval (95% CI) were calculated for the SB variable. The SB prevalence within EU countries, for the entire sample and separately for gender and age group (18–24, 25–34, 35–44, 45–54, 55–64, and 65 years and older) were analysed with a χ2 test for 2002, 2005, 2013, and 2017. Additionally, the χ2 test was implemented for comparing behaviour (SB, no-SB, or ‘don’t know’) and years (2002, 2005, 2013, and 2017) along with the analysis of the adjusted standardised residuals. Furthermore, the within-country and within-year differences by gender in SB were analysed using a Z-Score for two population proportions. A priori alpha level was set at 0.05. Z-score analyses were performed with Microsoft Excel version 1709 (Microsoft Corporation; Redmond, Washington, United States of America). Remaining analyses were performed using the Statistical Package for Social Sciences (version 22.0, SPSS Inc., Chicago, IL, USA).
Results
Significant differences in the prevalence of SB between countries for the entire country sample were observed in 2002 (n = 15,363; χ2 = 791.963; DF = 28; p < 0.001), 2005 (n = 26,413; χ2 = 1990,145; DF = 54; p < 0.001), 2013 (n = 26,988; χ2 = 1744,015; DF = 52; p < 0.001) and 2017 (n = 27,240; χ2 = 1488,979; DF = 52; p < 0.001). Similarly, significant differences between countries were also observed for men in 2002 (n = 7082; χ2 = 381,420; DF = 28; p < 0.001), 2005 (n = 11,286; χ2 = 1111,757; DF = 54; p < 0.001), 2013 (n = 12,063; χ2 = 828,192; DF = 52; p < 0.001) and 2017 (n = 12,115; χ2 = 777,311; DF = 52; p < 0.001); and women in 2002 (n = 8281; χ2 = 441,942; DF = 28; p < 0.001), 2005 (n = 15,127; χ2 = 1057,698; DF = 54; p < 0.001), 2013 (n = 14,925; χ2 = 1005,487; DF = 52; p < 0.001) and 2017 (n = 15,125; χ2 = 79,778; DF = 52; p < 0.001). Descriptive characteristics of the sample can be found in Table 1.
An association between the prevalence of SB and the years were found for the whole sample (n = 96,004; χ2 = 727,982; DF = 6; p < 0.001). These associations were also found for men (n = 42,546; χ2 = 307,233; DF = 6; p < 0.001) and women (n = 53,458; χ2 = 423,673; DF = 6; p < 0.001) separately. As is reflected in Fig. 1, over the 15 year-period in the EU member countries, the adjusted standardized residuals showed an increase in the prevalence observed versus the expected during 2013 and 2017 for the whole sample (adjusted standardized residuals = 2.9 and 13.1) and women (adjusted standardized residuals = 3.1 and 9.8), but only during 2017 for men (adjusted standardized residuals = 8.7). This trend was similar for each of the age groups analysed. Significant differences in the prevalence of SB between age groups for 2002 (χ2 = 179,189; DF = 10; p < 0.001), 2005 (χ2 = 289,434; DF = 10; p < 0.001), 2013 (χ2 = 184,806; DF = 10; p < 0.001) and 2017 (χ2 = 161,136; DF = 10; p < 0.001) were observed. The SB prevalence for 18–24 and 65 years and older age groups was higher than the expected for all years. Likewise, there were significant differences within age group between years (p < 0.001) (Table 2). However, SB prevalence was higher than the expected only for 2013 and 2017 in 35–44 age group, and 2017 in 45–54, 55–64 and 65 years and older age groups.
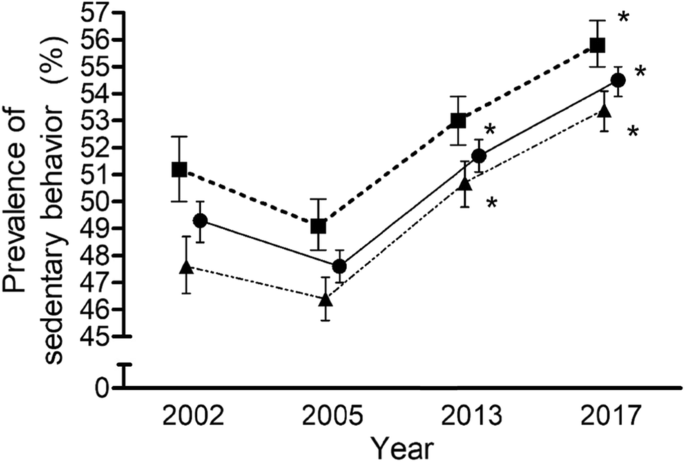
Prevalence (%) of sedentary behaviour (>4h30min/day) in European Union adults (in squares, the men sample; in circles, the whole sample; and in triangles, the women sample) for 2002, 2005, 2013, and 2017. Data are means ± CI. Analysis of the adjusted standardised residuals: *Higher observed prevalence of sedentary behaviour than the expected for the group “>4h30min”
In 2004, the number of EU countries increased from 15 to 28. Therefore, an additional analysis was performed only considering the first 15 countries. For this group of countries, an association between SB prevalence and the years were found for the whole sample (n = 60,325; χ2 = 661,052; DF = 6; p < 0.001). The analysis of the residuals showed an increase in the prevalence of SB observed versus the expected during 2013 and 2017 (adjusted standardised residuals = 4.5 and 12.3). These differences were also found for men (n = 28,060; χ2 = 333,673; DF = 6; p < 0.001) and women (n = 32,265; χ2 = 329,483; DF = 6; p < 0.001) separately. An increase was also reported in the prevalence of SB observed versus the expected during 2013 and 2017 for men (adjusted standardised residuals = 3.2 and 8.2) and women (adjusted standardised residuals = 3.1 and 9.0).
All the countries showed changes in SB prevalence between years (Table 2), with most of them showing an observed higher prevalence in 2017 than the expected (i.e., Austria, Belgium, Bulgaria, Estonia, France, Germany, Great Britain, Greece, Hungary, Italy, Ireland, Lithuania, Malta, Portugal, Romania, Slovakia, Slovenia, Sweden, and The Netherlands). Only Finland showed fewer observed cases than the expected for 2017.
While considering the subsamples of men and women separately for every country, and as can be observed in Table 3, similar patterns are generally reported. Differences between years were observed for most of the countries except for men in Croatia. The SB prevalence observed in 2017 was higher than the expected for men in Austria, Germany, Great Britain, Hungary, Ireland, Lithuania, Portugal, Romania, Slovakia, Sweden, and The Netherland. For women, the increase in the cases reported versus the expected was observed for Belgium, Bulgaria, France, Greece, Hungary, Italy, Ireland, Malta, Portugal, Romania, Slovenia, Sweden, and The Netherland.
When analysing gender differences (Table 3), SB prevalence in the overall EU sample was significantly higher in men compared to women for the whole sample. Almost all countries displayed greater SB prevalence in men in comparison with women over the years, with the following exceptions showing higher levels of SB prevalence in women in 2002 (Germany, Denmark, Ireland, and Spain), 2005 (Austria, Bulgaria, Estonia, Greece, Hungary, Latvia, Lithuania, Poland, and Slovakia), 2013 (Austria, Bulgaria, Estonia, Hungary, Latvia, Lithuania, Poland, Romania, and Sweden), and 2017 (Belgium, Bulgaria, Czech Republic, Estonia, Greece, Hungary, Italy, Latvia, Lithuania, Slovenia, and Sweden). Only five countries have shown a greater SB prevalence in women versus men for all the years (Bulgaria, Estonia, Hungary, Latvia, and Lithuania).
Discussion
The main findings were that (a) there was a recurrent difference between countries for all years, indicating that there is a dissimilar capability to prevent or reduce the prevalence of SB across the EU; (b), there was an increase in SB prevalence in the European adults from 2005 to 2017 considering the whole sample and men and women separately; and (c) there was a generally higher prevalence of SB in men than women, with a similar descriptive trend from 2005 to 2017.
Previous studies have reported that SB was rather stable over the 15-year period [23], or even declined based on 2002, 2005, and 2013 Eurobarometer data [24]. Nevertheless, there is an important difference to consider when comparing our data with the findings of the previous studies. Jelsma et al. (2019) [23] analysed only the percentages of population with more than 7h30mins per day of SB, while Milton et al. (2015) established conclusions with the data of the high sitting group (> 7h30min) when the middle sitting group (> 4 h31 to 7 h30 min) was not included in the analysis [24]. When considering the 4h30min group, there exists a trend of increasing SB prevalence over the years, similarly to ours. This discrepancy is very relevant to consider when analysing the information provided by each of these studies since it could lead to different outcomes. In our opinion, considering individuals with >4h30mins is pertinent because different studies have already shown an increased risk of suffering cardiovascular diseases and premature death in people who accumulate more than 4 h daily of SB [3, 19]. While it is clear that increased hours of SB results in worsening health outcomes, reducing individual-level SB time, for all individuals, yields the greatest overall public health benefit. For example, as reducing sitting time by ~ 2 h/day results in a 2.3% decrease in mortality [7].
This increase in the prevalence of SB could be explained by the social and environmental changes. For example, longer work commute durations, a greater number of labour-saving devices both at home and work [34] and urban environment inequalities that force people to travel longer distances and live in areas that lack support for active lifestyles [35] could all be contributing to the increased SB time. Furthermore, work and leisure-time are related to technology and consequently, people of all ages are spending more time interacting with technology in the form of Internet, videogames, interactive television, mobile phones, etc. [36].
Policy development on SB prevention has received increased attention in the last decade [18]. Some general recommendations from national and international organisations began to emerge at the end of the 2000s for reducing SB, such as the example the EU Physical Activity Guidelines [37] or the Physical Activity and Health Report from the U.S. [38], and most notably the World Health Organization supporting evidence to action through the Physical Activity and Health in Europe [39]. Policy-level interventions to reduce SB are, however, less developed than those attempting to reduce population levels of physical inactivity [40]. A previous analysis review found that only 22% of PA guidelines mentioned SB as part of a policy [41]. Besides, another study showed that very few countries had documents related to SB independently of PA policies [42]. This is despite evidence that suggests SB has more influence on decreasing health outcomes compared to physical inactivity [43]. In this sense, some countries may have more recently developed SB policies. In contrast, others still do not have any defined guidelines, aim, or even specific surveillance and monitoring systems that could help reduce SB.
In line with early calls to introduce public health guidelines on SB as soon as possible [44], some countries have made attempts to develop a policy regarding SB such as Belgium [45], France [46], Germany [47], Great Britain [48, 49], Spain [50], Sweden [51], and the Netherlands [52]. Still, a greater focus across all EU countries is required. This needs to extend to include appropriate surveillance and monitoring systems that assess attempts to reduce SB as well as guidelines themselves. This has been identified recently [53], underlining the importance of the evidence base when developing prescriptive public health guidance on SB as once established, and they are difficult to modify without generating confusion – as seen with the PA guidelines [54].
Regarding gender differences, results are consistent with previous studies where the prevalence of SB was always higher in men than women [9, 23, 24, 55]. Previous studies have shown that regarding gender, SB might be context-dependent [22]. For example, highly educated individuals spend more time sitting, which is still the case for more men than women in some EU countries, particularly those in Eastern Europe [9]. On the other hand, older women have been shown to be less sedentary than older men, probably because they still spend more time on household activities [56]. An alternative explanation could be related to the pattern of SB, in which women are more likely to accumulate their sedentary time in shorter bouts and, therefore, more likely to break up prolonged periods of sitting than men [56]. The consistent finding of higher SB prevalence in men should be an important point of consideration when discussing policy for SB reduction efforts.
Some limitations of this study should be recognised. Firstly, methodological differences exist between 2002 and 2005 and 2013–2017 data collection, which was solved using the same cut-points for each of the 4 years data were collected. Secondly, SB was assessed using a single recall item focused on one typical day, yet SB oscillates greatly from 1 day to another. Eurobarometer data may, therefore, underestimate sitting time when compared to an objective tool such as accelerometry, which is the gold standard for SB [10, 57,58,59]. Lastly, our study did not contemplate specific patterns of SB regarding breaking time of SB while standing, stretching, or including light PA, which might have different effects on the individuals.
Despite general efforts internationally to reduce SB, current data make clear the need for strengthening existing policies and developing new ones to address SB prevalence. Although numerous studies acknowledge the hazards of excessive SB, there are very few specific SB recommendations at a population level. Moreover, guidelines should target SB independently of PA, with specific goals and key performance indicators identified to reduce SB [42]. SB is arguably an easier behaviour to perform than PA, because no equipment is required, and it can be as simple as a person standing. It has been acknowledged that reducing SB is the first step on the physical activity behavioral continuum [60], meaning that changes to SB could also facilitate increases in PA in the future. Policies would need to make clear to the public how to reduce SB in tangible ways. Policies also need to articulate the difference between SB and PA clearly. Secondly, countries with SB defined policies should assess and strengthen said policies, monitoring surveillance data, and evaluating previous and ongoing interventions [16]. Countries without policies should develop plans on SB, following current recommendations, and learning from others that have shown even moderate success [16, 42]. Finally, none of the EU countries considered gender in their written policy, yet it is clear that gender differences exist in the volume and pattern of SB [56].
Conclusions
There were differences in SB prevalence between EU countries for all the years when considering the whole sample and for men and women separately, indicating an unequal capacity for tackling sedentary behaviour in the continent. Additionally, and considering the last 15 years of SB monitoring, an increase in SB for EU adults was observed both as a whole and while considering genders separately, indicating a limited impact of existing SB policy. Lastly, a generally higher SB prevalence in men than women is usually reported, remaining consistent over time. Futures analyses should be implemented across EU with objective measures of SB.
Availability of data and materials
The raw data is owned by the European Commission and available online (Special Eurobarometer 183–6, December 2002: https://dbk.gesis.org/ dbksearch/sdesc2.asp?no=3886&search=58.2&search2=&field=all& field2=all&DB=e&tab=0¬abs=&nf=1&af=&ll=10. Special Eurobarometer 246, December 2005: https://dbk.gesis.org/dbksearch/sdesc2.asp?no=4415& search=64.3&search2=&field=all&field2=&DB=e&tab=0¬abs=& nf=1&af=&ll=10. Special Eurobarometer 412, March 2014: https://dbk.gesis.org/dbksearch/sdesc2.asp?no=5877&search=Physical%20fitness%20and%20exercise&search2=&field=all&field2=&DB=e&tab=0¬abs=&nf=1&af=&ll=10. Special Eurobarometer 472, March 2018: https://dbk.gesis.org/dbksearch/sdesc2.asp?no=6939&search=Physical%20fitness%20and%20exercise&search2=&field=all&field2=&DB=e&tab=0¬abs=&nf=1&af=&ll=10).
Abbreviations
- CI:
-
Confidence interval
- IPAQ:
-
International Physical Activity Questionnaire
- PA:
-
Physical activity
- SB:
-
Sedentary behaviour
- WHO:
-
World Health Organization
References
Tremblay MS, Aubert S, Barnes JD, Saunders TJ, Carson V, Latimer-Cheung AE, et al. Sedentary behavior research network (SBRN) - terminology consensus project process and outcome. Int J Behav Nutr Phys Act. 2017;14:1–17.
Biswas A, Oh PI, Faulkner GE, Bajaj RR, Silver MA, Mitchell MS, et al. Sedentary time and its association with risk for disease incidence, mortality, and hospitalization in adults a systematic review and meta-analysis. Ann Intern Med. 2015;162(2):123–32.
Ekelund U, Steene-Johannessen J, Brown WJ, Fagerland MW, Owen N, Powell KE, et al. Does physical activity attenuate, or even eliminate, the detrimental association of sitting time with mortality? A harmonised meta-analysis of data from more than 1 million men and women. Lancet (London, England). 2016;388:1302–10.
Ekelund U, Brown WJ, Steene-Johannessen J, Fagerland MW, Owen N, Powell KE, et al. Do the associations of sedentary behaviour with cardiovascular disease mortality and cancer mortality differ by physical activity level? A systematic review and harmonised meta-analysis of data from 850 060 participants. Br J Sports Med. 2019;53:886–94.
Patterson R, McNamara E, Tainio M, de Sá TH, Smith AD, Sharp SJ, et al. Sedentary behaviour and risk of all-cause, cardiovascular and cancer mortality, and incident type 2 diabetes: a systematic review and dose response meta-analysis. Eur J Epidemiol. 2018;33(9):811–29.
Ng SW, Popkin BM. Time use and physical activity: a shift away from movement across the globe. Obes Rev. 2012;13(8):659–80.
Rezende LFM, Sá TH, Mielke GI, Viscondi JYK, Rey-López JP, Garcia LMT. All-cause mortality attributable to sitting time: analysis of 54 countries worldwide. Am J Prev Med. 2016;51(2):253–63.
SFM C, De CM, De CK, Powell L, Van CJ, Dall P, et al. How does light-intensity physical activity associate with adult cardiometabolic health and mortality ? Systematic review with meta-analysis of experimental and observational studies. 2018;1–8.
Bennie JA, Chau JY, van der Ploeg HP, Stamatakis E, Do A, Bauman A. The prevalence and correlates of sitting in European adults - a comparison of 32 Eurobarometer-participating countries. Int J Behav Nutr Phys Act. 2013;10:107.
Loyen A, van der Ploeg HP, Bauman A, Brug J, Lakerveld J. European sitting championship: prevalence and correlates of self-reported sitting time in the 28 European Union member states. PLoS One. 2016;11:e0149320.
O’Donoghue G, Perchoux C, Mensah K, Lakerveld J, van der Ploeg H, Bernaards C, et al. A systematic review of correlates of sedentary behaviour in adults aged 18-65 years: a socio-ecological approach. BMC Public Health. 2016;16:163.
Chastin SFM, Palarea-Albaladejo J, Dontje ML, Skelton DA. Combined effects of time spent in physical activity, sedentary behaviors and sleep on obesity and cardio-metabolic health markers: a novel compositional data analysis approach. PLoS One. 2015;10:e0139984.
Duvivier BMFM, Bolijn JE, Koster A, Schalkwijk CG, Savelberg HHCM, Schaper NC. Reducing sitting time versus adding exercise: differential effects on biomarkers of endothelial dysfunction and metabolic risk. Sci Rep. 2018;8(1):8657.
van der Berg JD, Stehouwer CDA, Bosma H, van der Velde JHPM, Willems PJB, Savelberg HHCM, et al. Associations of total amount and patterns of sedentary behaviour with type 2 diabetes and the metabolic syndrome: the Maastricht study. Diabetologia. 2016;59(4):709–18.
World Health Organization. Global recommendations on physical activity for health. Geneva: World Health Organization. 2010.
World Health Organization. Global action plan on physical activity 2018–2030. Geneva: World Health Organization. 2018.
World Health Organization. Global action plan for the prevention and control of noncommunicable diseases 2013–2020. Geneva: World Health Organization. 2013.
Biddle SJH, Bennie JA, De Cocker K, Dunstan D, Gardiner PA, Healy GN, et al. Controversies in the science of sedentary behaviour and health: insights, perspectives and future directions from the 2018 Queensland sedentary behaviour think tank. Int J Environ Res Public Health. 2019;16:4762.
Chastin SFM, De Craemer M, De Cocker K, Powell L, Van Cauwenberg J, Dall P, et al. How does light-intensity physical activity associate with adult cardiometabolic health and mortality? Systematic review with meta-analysis of experimental and observational studies. Br J Sports Med. 2019;53(6):370–6.
World Health Organization. WHA55.23: Diet, physical activity and health. Resolution. Geneva: World Health Organization. 2002.
Sjöström M, Oja P, Hagströmer M, Smith BJ, Bauman A. Health-enhancing physical activity across European Union countries: the Eurobarometer study. J Public Health (Bangkok). 2006;14:291–300.
Lakerveld J, Loyen A, Schotman N, Peeters CFW, Cardon G, van der Ploeg HP, et al. Sitting too much: a hierarchy of socio-demographic correlates. Prev Med (Baltim). 2017;101:77–83.
Jelsma JGM, Gale J, Loyen A, van Nassau F, Bauman A, van der Ploeg HP. Time trends between 2002 and 2017 in correlates of self-reported sitting time in European adults. PLoS One. 2019;14:e0225228.
Milton K, Gale J, Stamatakis E, Bauman A. Trends in prolonged sitting time among European adults: 27 country analysis. Prev Med (Baltim). 2015;77:11–6.
Matthews CE, Chen KY, Freedson PS, Buchowski MS, Beech BM, Pate RR, et al. Amount of time spent in sedentary behaviors in the United States, 2003-2004. Am J Epidemiol. 2008;167:875–81.
Pinto Pereira SM, Ki M, Power C. Sedentary behaviour and biomarkers for cardiovascular disease and diabetes in mid-life: the role of television-viewing and sitting at work. PLoS One. 2012;7:e31132.
Dunstan DW, Barr ELM, Healy GN, Salmon J, Shaw JE, Balkau B, et al. Television viewing time and mortality: the Australian diabetes, obesity and lifestyle study (AusDiab). Circulation. 2010;121:384–91.
Stamatakis E, Gale J, Bauman A, Ekelund U, Hamer M, Ding D. Sitting time, physical activity, and risk of mortality in adults. J Am Coll Cardiol. 2019;73(16):2062–72.
Christiansen NV, Kahlmeier S, Racioppi F. Sport promotion policies in the European Union: results of a contents analysis. Scand J Med Sci Sport. 2014;24:428–38.
Sallis JF, Bull F, Guthold R, Heath GW, Inoue S, Kelly P, et al. Progress in physical activity over the Olympic quadrennium. Lancet. 2016;388:1325–36.
European Opinion Research Group. Special Eurobarometer 421. European Commission. 2014.
European Opinion Research Group. Special Eurobarometer 472. European Commission. 2018.
Craig CL, Marshall AL, Sjöström M, Bauman AE, Booth ML, Ainsworth BE, et al. International physical activity questionnaire: 12-country reliability and validity. Med Sci Sports Exerc. 2003;35:1381–95.
Brownson RC, Boehmer TK, Luke DA. Declining rates of physical activity in the United States: what are the contributors? Annu Rev Public Health. 2005;26:421–43.
Rydin Y, Bleahu A, Davies M, Dávila JD, Friel S, De Grandis G, et al. Shaping cities for health: complexity and the planning of urban environments in the 21st century. Lancet (London, England). 2012;379:2079–108.
Owen N, Healy GN, Matthews CE, Dunstan DW. Too much sitting: the population health science of sedentary behavior. Exerc Sport Sci Rev. 2010;38:105–13.
EU Working Group Sport & Health. EU physical activity guidelines–recommended policy actions in support of health-enhancing physical activity. Brussels: EU Working Group Sport & Health. 2008.
U.S. Department of Health and Human Services. 2008 Physical activity guidelines for Americans. Pres Counc Phys Fit Sport Res Dig. 2008;9:1–8.
Cavill N, Kahlmeier S, Racioppi F. Physical activity and health in Europe: evidence for action. Genova: World Health Organization Regional Office for Europe; 2006.
Owen N, Sugiyama T, Eakin EE, Gardiner PA, Tremblay MS, Sallis JF. Adults’ sedentary behavior determinants and interventions. Am J Prev Med. 2011;41:189–96.
Klepac Pogrmilovic B, O’Sullivan G, Milton K, Biddle SJH, Bauman A, Bull F, et al. A global systematic scoping review of studies analysing indicators, development, and content of national-level physical activity and sedentary behaviour policies. Int J Behav Nutr Phys Act. 2018;15:123.
Coenen P, Gilson N, Healy GN, Dunstan DW, Straker LM. A qualitative review of existing national and international occupational safety and health policies relating to occupational sedentary behaviour. Appl Ergon. 2017;60:320–33.
Panahi S, Tremblay A. Sedentariness and health: is sedentary behavior more than just physical inactivity? Front public Heal. 2018;6:258.
Hamilton MT, Healy GN, Dunstan DW, Zderic TW, Owen N. Too little exercise and too much sitting: inactivity physiology and the need for new recommendations on sedentary behavior. Curr Cardiovasc Risk Rep. 2008;2:292–8.
Flemish Government. Flemish consensus statement regarding balanced diet and physical activity [in Flemish]. 2012.
Ministry of Health and Solidarity. Physical activity and health. Scientific reasons, practical tips [In French]. Paris. 1998.
Füzéki E, Vogt L, Banzer W. German National Physical Activity Recommendations for Adults and Older Adults: Methods, Database and Rationale. Gesundheitswes (Bundesverband der Arzte des Offentl Gesundheitsdienstes). 2017;79(S01):20–8.
Foster TK. Harkin J. Let’s get moving – a physical activity care pathway. Commissioning guidance. London: Department of Health. 2012.
Varney J, Brannan M, Aaltonen G. Everybody active, every day: an evidence-based approach to physical activity. London: Public Heal Engl. 2014.
Ministry of Health. Spanish strategy for nutrition, physical activity and prevention of obesity. Madrid: Ministry of Health. 2005.
Jansson E, Hagströmer M, Anderssen SA. Rekommendationer om fysisk aktivitet för vuxna. In: Fyss; 2015.
Weggemans RM, Backx FJG, Borghouts L, Chinapaw M, Hopman MTE, Koster A, et al. The 2017 Dutch physical activity guidelines. Int J Behav Nutr Phys Act. 2018;15(1):58.
Stamatakis E, Ekelund U, Ding D, Hamer M, Bauman AE, Lee I-M. Is the time right for quantitative public health guidelines on sitting? A narrative review of sedentary behaviour research paradigms and findings. Br J Sports Med. 2019;53:377–82.
Thompson D, Batterham AM, Markovitch D, Dixon NC, Lund AJS, Walhin J-P. Confusion and conflict in assessing the physical activity status of middle-aged men. PLoS One. 2009;4:e4337.
Loyen A, Van Hecke L, Verloigne M, Hendriksen I, Lakerveld J, Steene-Johannessen J, et al. Variation in population levels of physical activity in European adults according to cross-European studies: a systematic literature review within DEDIPAC. Int J Behav Nutr Phys Act. 2016;13:72.
Bellettiere J, Carlson JA, Rosenberg D, Singhania A, Natarajan L, Berardi V, et al. Gender and age differences in hourly and daily patterns of sedentary time in older adults living in retirement communities. PLoS One. 2015;10:e0136161.
LaMonte MJ, Lee I-M, Rillamas-Sun E, Bellettiere J, Evenson KR, Buchner DM, et al. Comparison of questionnaire and device measures of physical activity and sedentary behavior in a multi-ethnic cohort of older women. J Meas Phys Behav. 2019;2:82–93.
Prince SA, LeBlanc AG, Colley RC, Saunders TJ. Measurement of sedentary behaviour in population health surveys: a review and recommendations. PeerJ. 2017;5:e4130.
Prince SA, Cardilli L, Reed JL, Saunders TJ, Kite C, Douillette K, et al. A comparison of self-reported and device measured sedentary behaviour in adults: a systematic review and meta-analysis. Int J Behav Nutr Phys Act. 2020;17:31.
Buckley JP, Hedge A, Yates T, Copeland RJ, Loosemore M, Hamer M, et al. The sedentary office: an expert statement on the growing case for change towards better health and productivity. Br J Sports Med. 2015;49:1357–62.
Acknowledgements
Not applicable.
Funding
This paper arises from the mobility program “On the Move” granted by the Society of Spanish Researchers in the United Kingdom to XM. The funder had no role in study design, data collection and analysis, interpretation of data, decision to publish, or preparation of the manuscript.
Author information
Authors and Affiliations
Contributions
AL, XM, and AJ conceived and designed the study. AL analysed the data. AL, XM, GL, RC, ML, and AJ interpreted the data. AL, XM, and AJ drafted the manuscript. AL, XM, GL, RC, ML, and AJ revised critically the manuscript and approved the final version of the manuscript.
Corresponding author
Ethics declarations
Ethics approval and consent to participate
Not applicable.
Consent for publication
Not applicable.
Competing interests
There are no competing interests.
Additional information
Publisher’s Note
Springer Nature remains neutral with regard to jurisdictional claims in published maps and institutional affiliations.
Rights and permissions
Open Access This article is licensed under a Creative Commons Attribution 4.0 International License, which permits use, sharing, adaptation, distribution and reproduction in any medium or format, as long as you give appropriate credit to the original author(s) and the source, provide a link to the Creative Commons licence, and indicate if changes were made. The images or other third party material in this article are included in the article's Creative Commons licence, unless indicated otherwise in a credit line to the material. If material is not included in the article's Creative Commons licence and your intended use is not permitted by statutory regulation or exceeds the permitted use, you will need to obtain permission directly from the copyright holder. To view a copy of this licence, visit http://creativecommons.org/licenses/by/4.0/. The Creative Commons Public Domain Dedication waiver (http://creativecommons.org/publicdomain/zero/1.0/) applies to the data made available in this article, unless otherwise stated in a credit line to the data.
About this article

Cite this article
López-Valenciano, A., Mayo, X., Liguori, G. et al. Changes in sedentary behaviour in European Union adults between 2002 and 2017. BMC Public Health 20, 1206 (2020). https://doi.org/10.1186/s12889-020-09293-1
Received:
Accepted:
Published:
DOI: https://doi.org/10.1186/s12889-020-09293-1