Table 3 Correlations between variables
AUDIT-C score | Club connectedness | Experienced harm | Second-hand harm | Witnessed harm | Wellbeing | Team cohesion | GI-T | GI_S | ATG-S | ATG-T | Alcohol expectations | Club membership | Volunteer roles | Drinking with teammates | |
|---|---|---|---|---|---|---|---|---|---|---|---|---|---|---|---|
AUDIT-C score | ___ | ||||||||||||||
Club connectedness | .18* | ___ | |||||||||||||
Experienced harm | .50** | .13 | ___ | ||||||||||||
Second-hand harm | .10 | −.15 | .32** | ___ | |||||||||||
Witnessed harm | .12 | −.16* | .42** | .65** | ___ | ||||||||||
Wellbeing | .04 | .28** | .10 | .01 | .12 | ___ | |||||||||
Team cohesion | .22** | .54** | .22** | −.15 | −.13 | .29** | ___ | ||||||||
GI-T | .117 | .54** | .08 | .17* | .23** | .18** | .85** | ___ | |||||||
GI_S | .22** | .43** | .58** | .08 | .02 | .16** | .74** | .522* | ___ | . | |||||
ATG-S | .25** | .49** | .24** | −.025 | −.034 | .27** | .84** | .55** | .55** | ___ | |||||
ATG-T | .16** | .48** | .15* | −.29** | −.21 | .27** | .83** | .74** | .42** | .61** | ___ | ||||
Alcohol expectations | .38** | .01 | .23** | .16* | .23** | .09 | .02 | .09 | .02 | .-.08 | .14* | ___ | |||
Club membership | .12 | .05 | .03 | .06 | .03 | .03 | .04 | .09 | −.06 | .07 | .02 | −.01 | ___ | ||
Volunteer roles | −.05 | −.14 | −.19* | −.13 | −.12 | −.06 | −.14 | −.11 | −.15* | −.16* | −.14 | .001 | −.30** | ___ | |
Drinking with teammates | .44** | .20* | .45** | .20* | .33** | .06 | .29** | .13 | .34** | .31** | .25** | .22** | .10 | −.20** | ___ |
- *p < 0.05
- **p < 0.001
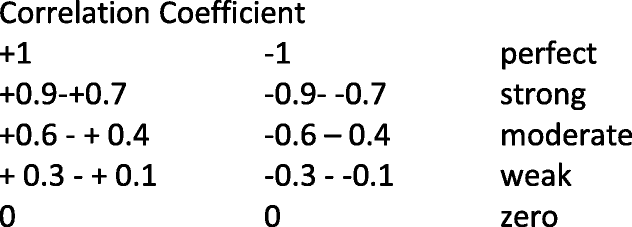
- Interpretation of Spearman’s Correlation Coefficients (54)